Patient Analytics Platform for Rare Disease Cohorts
Strategic Product Designer | 6 Months | Enterprise SaaS | HIPAA-Compliant
Designed an AI-powered patient analytics platform enabling pharmaceutical teams to build and validate rare disease cohorts in under 1 hour — reducing analysis turnaround from 3–4 weeks to <1 hour (98% time reduction), increasing dashboard adoption by 40%, and supporting $150M in identified market opportunity.
Problem
Pharma teams relied on data scientists writing custom SQL across fragmented EHR (Epic, Cerner) and claims systems (IQVIA, Symphony).
Cohort analysis took 3–4 weeks, workflows were inconsistent across regions, and manual exports introduced HIPAA risk.
68% of analysis requests were abandoned due to delays.
My Role
Strategic Product Designer leading UX across a cross-functional team (UX, Engineering, Data Science, Compliance).
Owned information architecture, visualisation strategy, and design system unification across the InsightsMAx ecosystem.
What I Did
-
Designed low-code cohort builder replacing SQL dependency
-
Embedded GenAI-assisted narrative summaries for business translation
-
Created vendor-agnostic filtering system across 4+ data sources
-
Built reusable component system reducing design–dev cycle time by 50%
-
Implemented compliance-first UX patterns

Impact
-
↓ 98% analysis time (3–4 weeks → <1 hour)
-
↑ 40% dashboard adoption
-
847 cohorts analyzed in first 3 months (70x increase)
-
30% faster design handoff cycles
-
Identified $150M companion diagnostic opportunity
-
Zero HIPAA violations post-launch
Marketing Intelligence Quotient (MIQ)
Lead UX Designer | Enterprise Marketing Analytics Platform
Problem
Enterprise marketing teams were drowning in scattered CRM, campaign, and analytics data.
Dashboards were cluttered, slow, and disconnected from ROI — limiting real-time decision-making and reducing campaign agility.
Non-technical marketers struggled to:
-
Build meaningful customer segments
-
Interpret propensity scores
-
Connect spend directly to business outcomes
The result: slow optimization cycles and underperforming campaigns.
My Role
Lead UX Designer collaborating with Data Science, Engineering, and Marketing Strategy teams.
Owned:
-
Product UX strategy
-
Information architecture
-
KPI prioritization framework
-
Visualization standards
-
Cross-platform workflow integration
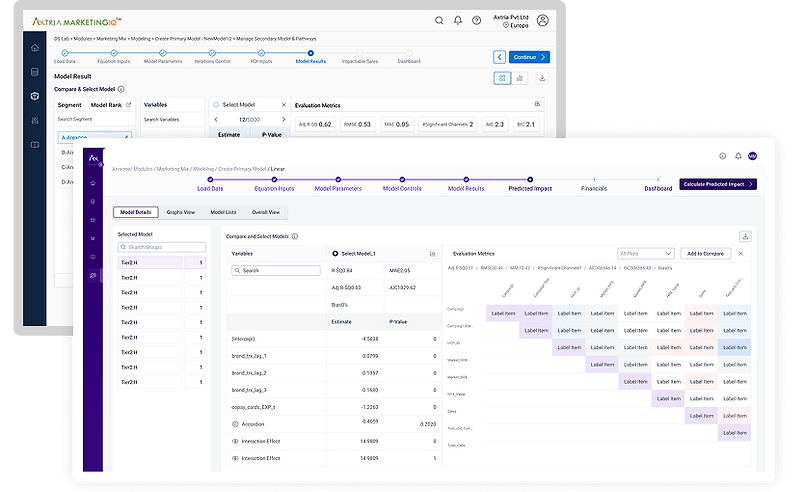
Redesigned a fragmented marketing analytics ecosystem into a unified, insight-driven platform — enabling marketers to move from raw data to campaign decisions in minutes, not days, through KPI-focused dashboards, real-time alerts, and AI-driven segmentation models.
Strategic Decisions
1. Reframed Dashboards Around Business Questions
Instead of showing all metrics, we structured views around:
-
“Which segments are underperforming?”
-
“Where should we reallocate spend?”
-
“What’s the projected lift?
2. Reduced Cognitive Load
Introduced KPI hierarchy and progressive disclosure to eliminate clutter and surface only decision-critical insights.
3. Embedded AI-Driven Segmentation
Integrated propensity modeling outputs directly into actionable workflows — not as separate data reports.
4. Enabled Real-Time Feedback Loops
Designed alert systems and scenario comparisons so teams could optimize campaigns mid-flight.
Impact
If you have numbers, insert them here. For example:
-
↓ 35% time to identify campaign optimization opportunities
-
↑ 28% adoption among non-technical marketing users
-
↑ 18% improvement in targeted campaign conversion rates
-
Reduced dependency on data analysts for segmentation tasks
If exact numbers are unavailable, use directional but credible impact statements:
-
Increased marketer self-serve usage
-
Improved cross-team alignment around ROI metrics
-
Accelerated campaign optimization cycles
Numbers convert. Vague impact does not.
This project demonstrates my ability to translate complex predictive models and multi-source marketing data into clear, decision-oriented experiences — aligning UX strategy directly with revenue impact.
BrandSpend IQ – Visual Portfolio Optimization for Marketing ROI
Lead UX Designer | 36-Month Enterprise Platform Initiative
Designed an interactive portfolio optimization platform enabling enterprise marketing teams to allocate budgets across multi-level brand hierarchies (Geography → Therapeutic Area → Brand) with real-time visibility into spend distribution — reducing planning friction and improving allocation confidence across complex portfolios.
Problem
Enterprise marketing teams managed budgets across deeply nested brand structures spanning geographies, therapeutic areas, and individual brands.
Allocation decisions were:
-
Manual and spreadsheet-driven
-
Hard to visualize across hierarchical levels
-
Prone to misalignment between strategic intent and actual spend
Users struggled to:
-
Define portfolio structures clearly
-
Understand relationships between levels and values
-
See real-time budget impact while allocating
Complexity created hesitation, errors, and slow planning cycles.
My Role
Lead UX Designer partnering with Data Science, Engineering, and Marketing Strategy teams over 36 months.
Owned:
-
Portfolio modeling UX strategy
-
Interaction architecture
-
Visualization framework
-
Cross-module design consistency
-
Real-time allocation workflows

Strategic Decisions
1. Clarified Mental Model (Levels vs Values)
Defined a structured hierarchy system:
-
Levels = Portfolio dimensions (Geography, TA, Brand)
-
Values = Instances within each level
Used interactive animation to anchor user understanding before allocation began.
2. Introduced Vertical Top-Down Tree Architecture
Designed a scalable hierarchy visualisation that mirrored strategic decision flow.
This reduced ambiguity and improved structural comprehension.
3. Split Workflow into Cognitive Phases
Step 1: Define portfolio structure
Step 2: Assign and optimise budget values
Separating structural definition from allocation reduced cognitive overload.
4. Built Real-Time React-Based Allocation Canvas
Enabled:
-
Dynamic budget flow visualisation
-
Immediate feedback on allocation impact
-
Scenario comparison
Users could experiment safely before finalising spend.
Impact
If you have numbers, add them here. For example:
-
↓ 30% planning time during annual budget cycles
-
↑ 25% increase in cross-team alignment on portfolio structure
-
Reduced allocation errors across hierarchical levels
-
Increased usage among non-technical marketing stakeholders
If hard metrics are unavailable, frame credible operational impact:
-
Standardized portfolio modeling across enterprise accounts
-
Reduced reliance on spreadsheet-based allocation
-
Improved transparency in budget governance
-
Enabled faster scenario planning
This project demonstrates my ability to design decision-support systems for complex enterprise environments — translating hierarchical data structures into intuitive, interactive planning tools that align strategy with financial outcomes.